As Kathryn Fryer says in her blog, if you are not defining RDF URIs for your type system elements, you should be! In her post and related article she defines the ins/outs of URIs and their associated best practices.
I can’t believe I haven’t already penned a post on the importance of defining URIs for the type systems in your IBM Engineering Lifecycle Management (ELM) applications. We have certainly mentioned it in many articles and presentations. I’ve finally published an article on Jazz.net all about URIs, how to define and apply them, and best practices.
If you haven’t read it yet – please do! Here’s a quick synopsis to whet your appetite…
A “uniform resource locator” (URI) unambiguously identifies a resource. In this case, the resources we’re talking about aren’t your actual data (requirements, work items, or what have you), but rather the type system that describes that data: artifact types, attributes, enumerated values, and link types.
The type system can vary by project area, and in DOORS Next Generation, by component and configuration. For link resolution and reporting, it’s critical that equivalent resources have the same URI. So…
I’ve blogged previously that work item attachments are typically one of the largest contributors to Engineering Workflow Management (EWM) repository size. Orphaned attachments, those attachments that have been removed, not deleted, from a work item can represent a large portion of work items in the repository.
One of the new features in EWM 7.0 is support for using a work item’s access control context as the access control context its attachments as well. To aid customers in migrating existing attachments to this new security model, the development team created an as-is, unsupported, Attachment Migration utility.
One of the options of the utility is to delete orphaned attachments and thus potentially reducing the size of your EWM repository. You would first analyze the repository to understand the count and total size of orphaned attachments (along with other cases like attachments linked to multiple work items).
The analyze and delete option can be run independent of any plans to migrate attachments to the new access control model, thus are useful to run in earlier versions of EWM (6.0.4 and up) independent of any plan to upgrade to 7.0.
Remember that as noted in the previous blog, once attachments or other items are deleted, their content in the repository must first be ‘freed’ up then later reclaimed by the database system.
With the reduction in travel due to the pandemic, I have had time to complete some blogs and articles I’ve wanted to finish. Additionally, I participated in some events that moved online. This post will highlight a few.
Planning your Global Configuration Management journey Engineering Academywebinar (delivered May 13) co-presented with Kathryn Fryer discusses common adoption and usage patterns when planning to adopt global configuration management. To view this and other webinars, you’ll need to first register for the Academy. Once registered, go to Engineering Academy > Academy sessions to find the webinar.
In 6.0.3, the Engineering Lifecycle Management (ELM) solution began publishing Java Management Extensions (JMX) MBeans for managing and monitoring ELM applications. In 6.0.5, the Lifecycle Query Engine (LQE) application began publishing its own MBeans. The recommended mechanism for collecting and viewing any of these MBeans is through an enterprise monitoring solution. However, often while getting familiar with MBean content while building your monitoring dashboards, you just want to browse the MBeans from a running system without having to first ingest it into a monitoring tool.
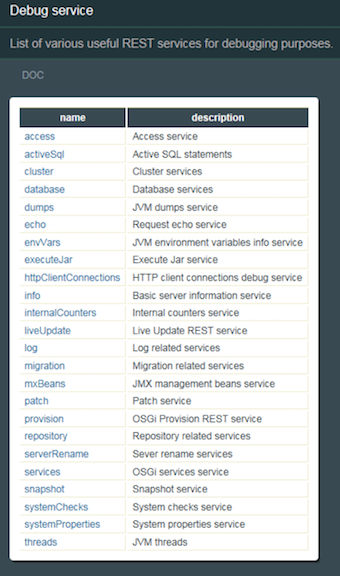
The typical method for doing so is via repodebug. This is described in the Troubleshooting section at the bottom of CLM Monitoring.
For the LQE application, repodebug can be used to view its MBeans if there are other MBean providers running on the same server. This is not typically the case as we recommend LQE be run on its own server. Fortunately, other options exist such as Jconsole and VisualVM. This post will describe how I used Jconsole to view the LQE MBeans from ELM 7.0 running on Windows and with Websphere Liberty as the application server. The instructions may differ slightly when used with traditional Websphere or another supported operating system.
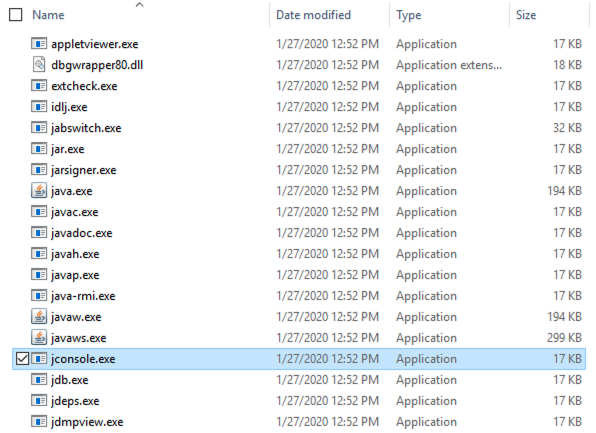
The base ELM install does not include Jconsole. It is generally part of any Java SDK install. I downloaded an IBM Java SDK to the LQE server. After expanding the zip file, navigate to the bin directory and run the jconsole.exe.
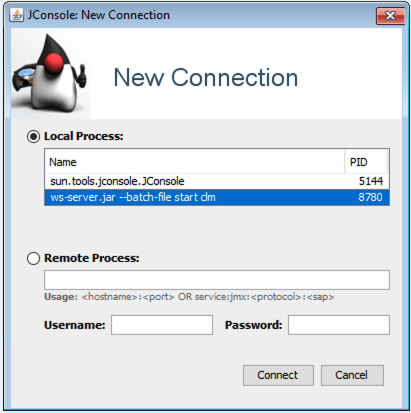
When the connection dialog appears, select Local Process and the ws-server.jar process then click Connect. I have not tried running this remotely using the Remote Process selection.
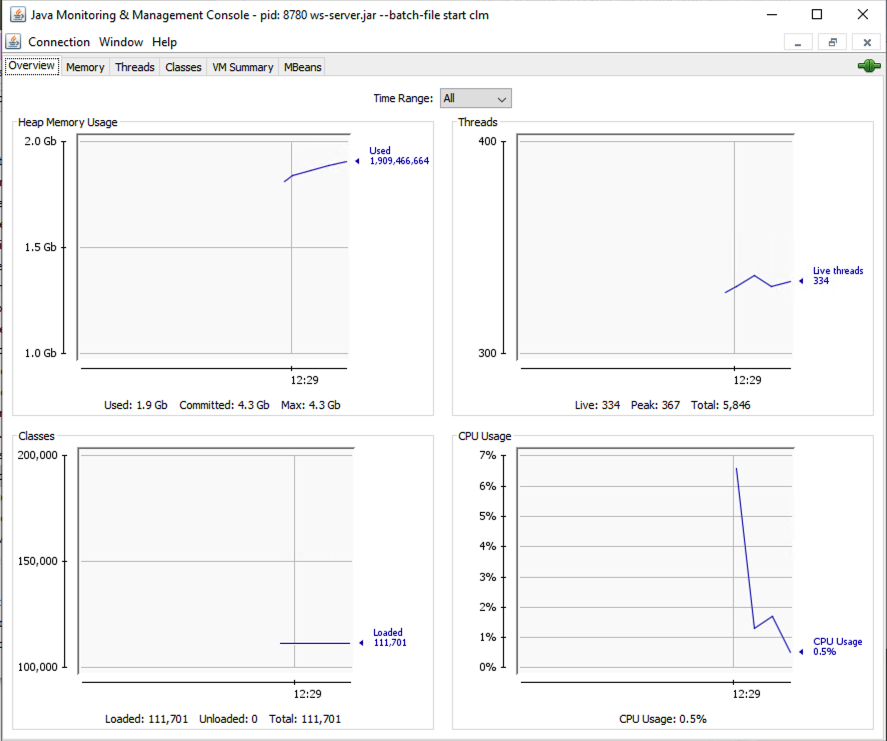
The main console window appears.
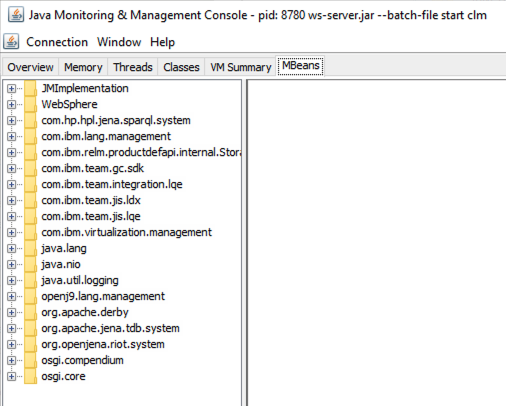
Select the MBeans tab.
Here you see several domains of MBeans, only a two of which apply to LQE: com.ibm.team.integration.lqe and com.ibm.team.jis.lqe. You’ll see there are also domains related to GC and LDX as I am running this on a server with multiple applications (despite my earlier comments regarding running LQE on its own server, but this is a test system). Note unlike many of our application MBeans, which need enabling to have them published, the LQE MBeans are collected and published automatically.
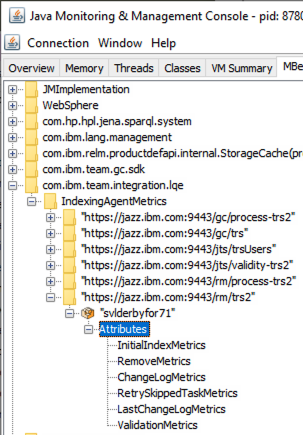
As described in Monitoring the performance of Lifecycle Query Engine using MBeans, there are MBeans that provide performance and activity metrics for the processing of the Tracked Resource Set (TRS) feeds. You can view these by navigating to com.ibm.team.integration.lqe > IndexingAgentMetrics then expanding one of the TRS feeds down to Attributes as shown below.
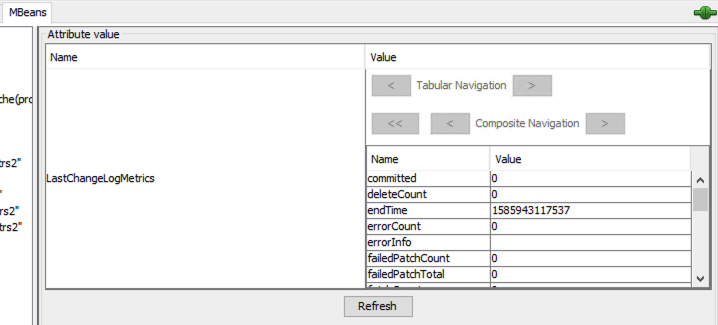
Select LastChangeLogMetrics in the Attributes list then double click javax.management.openbean.CompositDataSupport on the right panel under Value.
Now you can view and scroll through all the attributes for the LastChangeLogMetrics MBean
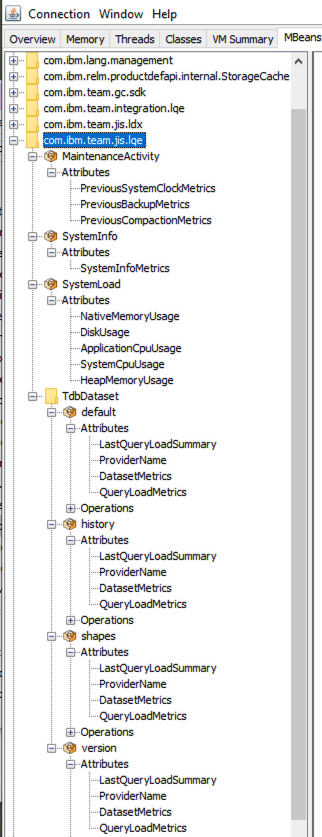
Similarly, you can navigate through the list of MBeans in the com.ibm.team.jis.lqe domain.
Viewing the MBeans this way only gives you the current snapshot of what has been published. You’ll get more value using an enterprise monitoring tool where the MBean data can be collected over time in a data warehouse from which dashboards showing trends and correlated with other MBean data can be created.
Almost five years ago I posted Help! My RTC Database is getting big! There have been a number of improvements since then so I think an update is appropriate.
First, to keep the offering managers and marketing team happy, I should point out that Rational Team Concert (RTC) is no longer the name but is now Engineering Workflow Management (EWM). See Renaming the IBM Continuous Engineering Portfolio for more information.
It is still true that build results, work item attachments and versioned conent are the largest contributors to EWM database size. Previously I referenced out of the box reports useful for determining which EWM namespaces occupied the most space. Since then I have documented web services and repotools reports, and Item Count Details JMX MBean that can be used to get the same information. See How many artifacts do I have in my Jazz application repository?.
Once you know which artifacts are taking up the most space, you then need to know what can and cannot be deleted. I point out some of this in the previous blog but we now have an article on the deployment wiki that goes into more detail. See Deleting data in Rational Team Concert.
A new technique for reducing the size of your EWM database is using an external content repository such as Artifactory for managing large versioned files. See Rational Team Concert: External content repositories. The article describes how to configure EWM to use an external content repository, move content in and out of it as well as serveral new JMX MBeans to monitor the size of external content repositories, size of EWM SCM components and size of the largest files.
I think the improvements since the original posting make it easier to monitor the growth of your repositories, understand what is causing it and provides better strategies for mitigating growth. As always your feedback is appreciated. If you have other techniques you find useful, please pass them on.
The following is a refresh of a previous post in 2016.
You’ve just made the decision to adopt one of the Jazz solutions from IBM. Of course, being the conscientious and proactive IT professional that you are, you want to ensure that you deploy the solution to an environment that is performant and scalable. Undoubtedly you begin scouring the IBM Knowledge Center and the latest System Requirements. You’ll find some help and guidance on Deployment and installation planning and even a reference to advanced information on the Deployment wiki. Unlike the incongruous electric vehicle charging station in a no parking zone, you are looking for definitive guidance but come away scratching your head still unsure of how many servers are needed and how big they should be.
This is a common question I am often asked, especially lately. I’ve been advising customers in this regard for several years now and thought it would be good to start capturing some of my thoughts. As much as we’d like it to be a cut and dried process, it’s not. This is an art not a science.
My aim here is to capture my thought process and some of the questions I ask and references I use to arrive at a recommendation. Additionally, I’ll add in some useful tips and best practices.
I find that the topology and sizing recommendations are similar regardless of whether the server is to be physical or virtual, on-prem or in the cloud, managed or otherwise. These impact other aspects of your deployment architecture to be sure, but generally not the number of servers to include in your deployment or their size. One exception is that managed cloud environments often start lower than the recommended target since those managing understand how to monitor the environment, look for indicators that more resources are needed and can quickly respond to increasing demands.
From the outset, let me say that no matter what recommendation I or one of my colleagues gives you, it’s only a point in time recommendation based on the limited information given, the fidelity of which will increase over time. You must monitor your Jazz solution environment. In this way you can watch for trends to know when a given server is at capacity and needs to scale by increasing system resources, changing the distribution of applications in the topology and/or adding a new server. See Deployment Monitoring for some initial guidance. Since 6.0.3, we have added capabilities to monitor Jazz applications using JMX MBeans. Enterprise monitoring is a critical practice to include in your deployment strategy.
Before we even talk about how many servers and their size, the other standard recommendation is to ensure you have a strategy for keeping the Public URI stable which maximizes your flexibility in changing your topology. We’ve also spent a lot of time deriving standard topologies based on our knowledge of the solution, functional and performance testing, and our experience with customers. Those topologies show a range in number of servers included. The departmental topology is useful for a small proof of concept or sandbox environment for developing your processes and procedures and required configuration and customization. For most production environments, a distributed enterprise topology is needed.
The tricky part is that the enterprise topology specifies a minimum of 8 servers to host just the Jazz-based applications, not counting the Reverse Proxy Server, Database Server, License Server, Directory Server or any of the servers required for non-Jazz applications (IBM or 3rd Party). For ‘large’ deployments of 1000 users or more that seems reasonable. What about smaller deployments of 100, 200, 300, etc. users? Clearly 8+ servers is overkill and will be a deterrent to standing up an environment. This is where some of the ‘art’ comes in. I find more often than not, I am recommending a topology that is some where between the department and enterprise topologies. In some cases, a federated topology is needed when a deployment has separate and independent Jazz instances but needs to provide a common view from a reporting perspective and/or for global configurations, in case of a product line strategy. The driving need for separate instances could be isolation, sizing, reduced exposure to failures, organizational boundaries, merger/acquisition, customer/supplier separation, etc.
The other part of the ‘art’ is recommending the sizing for a given server. Here I make extensive use of all the performance testing that has been done, including the following.
The CLM Sizing Strategy provides a comfortable range of concurrent users that a given Jazz application can support on a given sized server for a given workload. Should your range of users be higher or lower, your server be bigger or smaller or your workload be more or less demanding, then you can expect your range to be different or to need a different sizing. In other words, judge your sizing or expected range of users up or down based on how closely you match the test environment and workload used to produce the CLM Sizing Strategy. Concurrent use can come from direct use by the Jazz users but also 3rd party integrations as well as build systems and scripts. All such usage drives load so be sure to factor that into the sizing. There are other factors such as isolating one group of users and projects from another, that would motivate you to have separate servers even if all those users could be supported on a single server.
Should your expected number of concurrent users be beyond the range for a given application, you’ll likely need an additional application server of that type. For example, the CLM Sizing Strategy indicates a comfortable range of 400-600 concurrent users on a CCM (Engineering Workflow Management) server if just being used for work items (tracking and planning functions). If you expect to have 900 concurrent users, it’s a reasonable assumption that you’ll need two CCM servers. Scaling a Jazz application to support higher loads involves adding an additional server, which the Jazz architecture easily supports through multi-server or clustering topology patterns. Be aware though that there are some behavioral differences and limitations when working with the multi-server (not clustered) pattern. See Planning for multiple Jazz application server instances and its related topic links to get a sense of considerations to be aware of up front as you define your topology and supporting usage models. As of 6.0.6.1, application clustering is only available with the CCM application.
This post doesn’t address other servers likely needed in your topology such as a Reverse Proxy, Jazz Authorization Server (which can be clustered), Content Caching Proxy and License Key Server Administration and Reporting tool. Be sure to read up on those so you understand when/how they should be incorporated into your topology. Additionally, many of the performance and sizing references I listed earlier include recommendations for various JVM and application settings. Review those and others included in the complete set of Performance Datasheets and Sizing Guidelines. It isn’t just critical to get the server sizing right but the JVM and application properly tuned.
To get to the crux of the primary question of number of servers and their size, I ask a number of questions. Here’s a quick checklist of them.
What Jazz applications are you deploying?
What other IBM or 3rd party tools are you integrating with your Jazz applications?
How many total and concurrent users by role and geography are you targeting and expect to have initially? What is the projected adoption rate?
What is the average latency from each of the remote locations?
How much data (number of artifacts by domain) are you migrating into the environment? What is the projected growth rate?
If adopting IBM Engineering Workflow Management, which capabilities will you be using (tracking and planning, SCM, build)?
What is your build strategy? frequency/volume?
Do you have any hard boundaries needed between groups of users, e.g. organizational, customer/supplier, etc. such that these groups should be separated onto distinct servers?
What are your reporting needs? document generation vs. ad hoc? frequency? volume/size?
Most of these questions primarily allow me to get a sense of what applications are needed and what could contribute to load on the servers. This helps me determine whether the sizing guidance from the previously mentioned performance reports need to be judged higher or lower and how many servers to recommend. Other uses are to determine if some optimization strategies are needed.
As you answer these questions, document them and revisit them periodically to determine if the original assumptions, that led to a given recommended topology and size, have changed and thus necessitate a change in the deployment architecture. Validate them too with a cohesive monitoring strategy to determine if the environment usage is growing slower/faster than expected or detect if a server is nearing capacity. Another good best practice is to create a suite of tests to establish a baseline of response times for common day to day scenarios from each primary location. As you make changes in the environment, e.g. server hardware, memory or cores, software versions, network optimizations, etc., rerun the tests to check the effect of the changes. How you construct the tests can be as simple as a manual run of a scenario and a tool to monitor and measure network activity (e.g. Firebug). Alternatively, you can automate the tests using a performance testing tool. Our performance testing team has begun to capture their practices and strategies in a series of articles starting with Creating a performance simulation for Rational Team Concert using Rational Performance Tester.
In closing, the kind of guidance I’ve talked about often comes out in the context of a larger discussion which looks at the technical deployment architecture in a more wholistic perspective, taking into account several of the non-functional requirements for a deployment. This discussion is typically in the form of a Deployment Workshop and covers many of the deployment best practices captured on the Deployment wiki. These non-functional requirements can impact your topology and deployment strategy. Take advantage of the resources on the wiki or engage IBM to conduct one of these workshops.
Many of our customers are using Jenkins for their software builds integrated with Rational Team Concert (RTC) software configuration management (SCM). This is a powerful combination but one that should be managed carefully so as not to put undue load on the RTC server. Based on several customer experiences my colleagues and I from development and services have put together an article that captures our guidance and recommendations when using RTC as an SCM system in Jenkins jobs. Check it out here: Using Rational Team Concert for source code management in Jenkins jobs.
As a deployment architect when advising customers on their topology, I’m often asked about the supported options for reverse proxies and load balancing. Further, some customers ask about using DNS aliasing over a Reverse Proxy, which is supported but not a best practice.
While some of these details can be found in the Knowledge Center and deloyment wiki, we’ve not had a central article listing options with any comparisons. My colleagues in IBM Support have recently published an article with these details here: Reverse Proxies and Load Balancers in CLM Deployment.
Ralph Schoon has done some very useful work providing some automation around our best practice guidance for DNG type system management. Check out his blog post to learn more.
We finally published Maintaining the Rational DOORS Next Generation type system in a configuration-management-enabled environment. Part 3: Automation tool deep dive on Jazz.net.This was a major effort and took a long time to do. This article provides a closer look at the source code, what it does and how it does it. It also provides some insight in how OSLC4J works and can be used. The information in the article, especially for setup and deployment of the automation prototype is very reusable for other scenarios and I hope to be able to reuse it in later articles and blog posts.
In Resource-intensive scenarios that can degrade CLM application performance I describe how certain IBM Collaborative Lifecycle Management (CLM) application scenarios can be resource-intensive and known to degrade system performance at times. As I’ve intereracted with customers on their deployments and performance concerns, it is apparent that they are getting more and more creative in building custom automation scripts/utilities using our APIs. At times, these custom utilities have generated significant load on the system.
As a best practice, we now recommend that customers evaluate their custom utilities and determine if any are candidates to be resource-intensive. For those that are, they should be modified and registered as resource-intensive with appropriate start and stop scenario markers included in the code. Until recently, all we could provide to help do this was some code snippets.
Thanks to my colleagues Ralph Schoon, Dinesh Kumar and Shubjit Naik, we now have documented guidance and sample code to help you do this. Have a look at Register Custom Scripts As a Resource Intensive Scenario. Ralph also gives some additional detail behind the motivation for the custom scenario registration in his blog post.
Once registered, you will now be able to track their occurrence in the appropriate application log. If you’ve implemented enterprise application monitoring, you can track for available JMX MBeans as described in CLM Monitoring.