Tips for improved monitoring of your DNG environment

Let’s assume that you are convinced that application monitoring of your IBM CE/CLM environment is a good best practice. There are many JMX MBeans defined in the MBeans Reference List that your enterprise monitoring application can collect and manage. If just getting started, focus on the set of MBeans described in CLM Monitoring Primer. Once you’ve implemented the base set, you can expand from there.

Proactively monitor those MBeans by setting recommended thresholds with corresponding alert notifications to prompt further investigation. Thresholds may need to be adjusted over time based on experience. Monitor normal operations to establish appropriate baselines and adjust thresholds accordingly to reduce false negative alerts. Note that some monitoring tools have the ability to use machine learning and statistical analysis to adapt thresholds.

Based on some of my recent customer experiences, for DNG in particular, there are two key items I recommend you monitor beyond what’s called out in the primer or even currently available via an MBean. These will help you optimize the performance of your deployment.

JFS indexBacklog
Jena index updates occur when a write is being processed by DNG. The status of the index can be monitored through an indexing page (https://<server:port>/rm/indexing). A backlog indicates there are updates yet to be passed on to the Jena indexer for processing (e.g. after a large import). Ideally the backlog of the indexer should be low on a well performing system. When high, system performance may suffer temporarily until the indexer catches up. Symptoms of heavy indexing can be slow performance, or users not seeing data immediately after creation. See technote 1662167.

Even better, for those clients using an enterprise application monitoring tool and gathering our pubished MBeans, there is one that tracks the index backlog. The JFS Index Information MBean is available as of 6.0.5 and collected by the IndexDataCollectorTask. It can be used to gather not only the size of the index but the backlog of items waiting to be indexed. By default, data is collected every 60 mins. Alerts can be set so that if the backlog gets high, e.g. over 1000, admins may choose to warn users and slow down system activity so the indexer can catch up.

DNG write journal file
Once the DNG indexer completes indexing of changes to artifacts, if there are no read operations in progress, the update is committed to the main index, otherwise, it is written to a journal file. Once the last active read operation completes, changes in the journal file are written to the main index. This approach allows in-progress read queries to maintain a consistent view of the index, while allowing new read queries to see the latest data.

The DNG write journal file (journal.jrnl) is located in server/conf/rm/indices/<id>/jfs-rdfindex. The size of the journal file can be monitored through standard OS commands and scripts or through OS integrations typically available with enterprise monitoring applications. This file will grow over time but should regularly go back to zero. In the unlikely event that it does not, it’s a sign of a bottleneck where read activity is blocking write activity. System performance may be impacted at this point. When this happens, it’s best for DNG users to pause their DNG activity while the system catches up. One customer does this by notifying their users, removing DNG from the Reverse Proxy configuration (commenting out its entry), monitoring the journal file size until it returns to zero, then adding DNG back into the proxy configuration and informing the users.

As a teaser to future content, check out 124663: As an administrator, I should be able to monitor my server using MBeans, which will provide new DNG application MBeans to further aid administrators in proactively monitoring and managing a DNG system.

Alternatives to filtering on lifecycle traceability links in CLM 6.0 configuration management enabled projects

Today I’d like to continue on the theme started in Finding suspect links and requirements to reconcile in Collaborative Lifecycle Management (CLM) 6.0 configuration management enabled projects by addressing another consideration from Enabling configuration management in CLM 6.0 applications.

Do you need to filter views based on lifecycle traceability links?

In CLM 6.0 for those projects with configuration management enabled, you can view artifacts with their lifecycle traceability links, but cannot filter by those relationships.  There are three key areas this impacts:

  • Limit by lifecycle status in DOORS Next Generation (DNG)
  • Traceability views for RQM test artifacts
  • Linking RTC plans to artifact collections

I’ll explore some alternative workarounds to these in this blog.

Limit by lifecycle status in DOORS Next Generation (DNG)

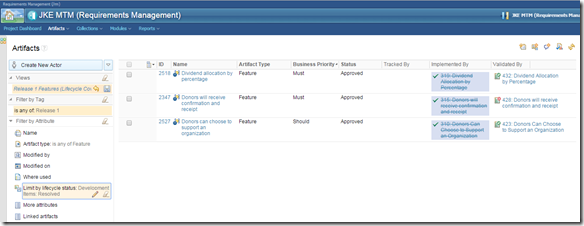
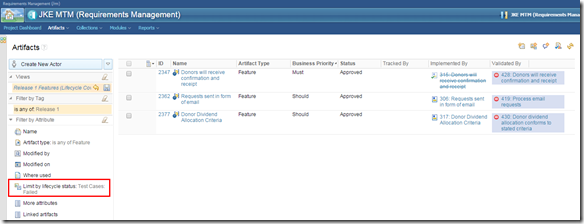
In CLM 5.x, views of requirements artifacts can be filtered by the status of lifecycle artifacts linked to them.  The same is true in CLM 6.0 but only for projects that don’t have configuration management enabled.  This limitation should be addressed in a future release by work item 97071.   Below is an example showing all feature requirements with failed test case runs.

image

Similarly, the following shows all feature requirements whose linked development items have been resolved.

image

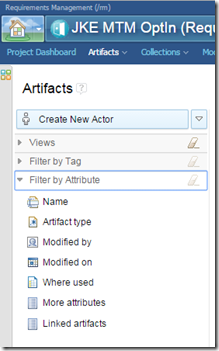
In CLM 6.0, for configuration management enabled projects, the lifecycle status filter option doesn’t even appear.

image

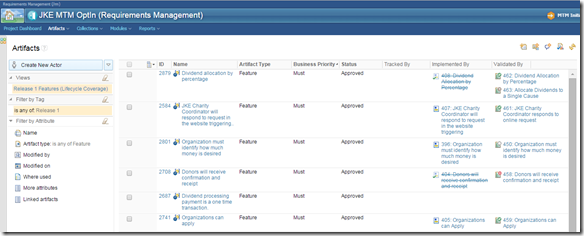
It is still possible to show a view of requirements with their lifecycle traceability links shown; it’s only the filtering that isn’t possible (at present).

image

Here you could scroll through the Validated By column, for instance, and manually scan for test cases whose icon indicated a failure occurred.  This wouldn’t be viable for more than a short list of requirements.

What’s needed then is to display a view/query of the linked artifacts, filtered appropriately, and display, if possible, their linked requirements.

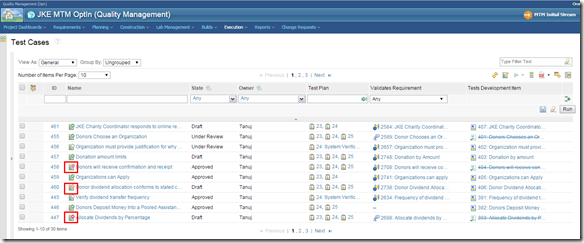
For example, show all failed test case runs in Rational Quality Manager (RQM) and their associated requirements.  When displaying all test cases, you can see visually by their associated icon, whether the test case has been run successfully or not.  This isn’t ideal given you aren’t able to filter by the test case status and must instead visually pick out the failed runs.  It does, however, show the linked requirement being validated.

image

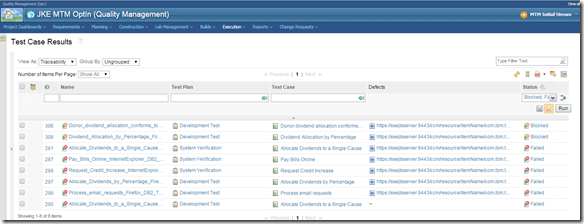
Alternatively, show a view of test case results and filter by their status.  Below is a list of test case results that are Failed or Blocked and their associated test case.

image

Unfortunately, it doesn’t also show the related requirement.  Instead you would need to drill down into the test case from the failed run and see its linked requirements.

Use of the Jazz Reporting Service Report Builder may be an option in limited cases.  First, it’s use for configuration management aware reporting is Technology Preview in 6.0 and only really contains configuration data for RQM.  For DNG, only the default configuration data is included for configuration management enabled DNG projects.  If your requirements configuration management needs are basic, where a single configuration/stream is sufficient, this may be an option.

For example, the following report shows all requirements with failed/blocked test case runs.

image

Now you’ll likely have multiple DNG projects.  DNG doesn’t publish project area data to the Lifecycle Query Engine (LQE) using Configurations data source so you can’t choose only those requirements artifacts from a given project, limit scope by that project nor set a condition to query by some DNG project area attribute.  You can, however, choose test artifacts for a given project area (and configuration) so if there’s a 1:1 relationship between DNG and RQM projects, you can produce a report that just shows the requirements from failed test case runs in the desired RQM project belonging to the desired global configuration (this is what is shown in the previous screenshot).

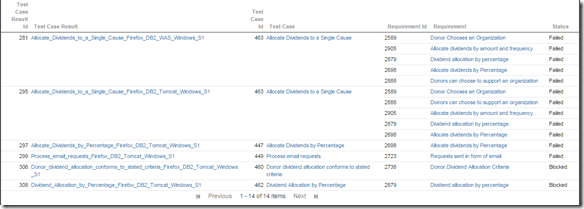
I tried looking at this from the opposite direction, that is, show all failed/blocked test case runs and their associated requirements.  You get the right list of failed runs, but it shows all their associated requirements, not all of which were tested and failed in that run.

image

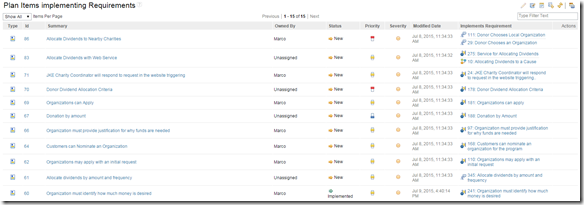
For the other example I gave earlier, show all requirements whose linked development items were resolved, you could go to Rational Team Concert (RTC) and run a lifecycle query such as Plan Items implementing Requirements, but you’d need to visually look for plan items whose status met your criteria as the query isn’t editable and thus you couldn’t add a filter.

image

Traceability views for RQM test artifacts

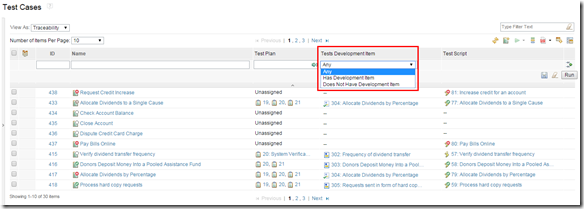
In CLM 5.x, views of test artifacts can be filtered by the presence (or not) of a linked development item.

image

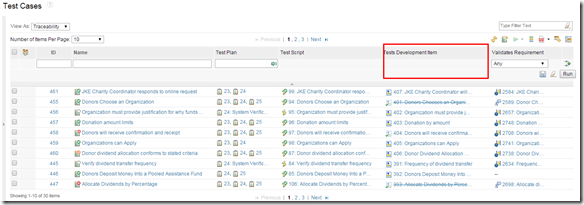
The same is true in CLM 6.0 but only for projects that don’t have configuration management enabled.  RQM projects that have configuration management enabled, don’t include that filter option.  This limitation should be addressed in a future release by work item 134672.

image

From this view, you would then need to visually scan the Test Development Item column for whichever condition you needed.

RTC has some lifecycle queries, such as Plan Items with no Test Case or Plan Items with failing Tests that could help.

image

image

Here again, Report Builder could help as you could construct a report that shows test cases with or without associated work items.  For example, the report below shows test cases without any work item associated.

image

Linking RTC plans to artifact collections

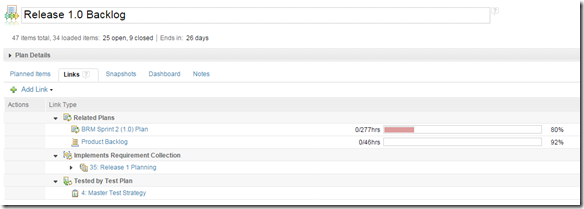
In CLM 5.x, it is possible to link an RTC plan to a DNG requirements collection and/or a RQM test plan.  Use of these grouped artifacts allows for shared scope and constraints across these lifecycle plans and are useful in auto filling gaps in plans or reconciling changes.

image

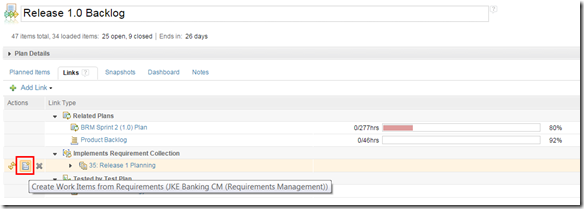
In CLM 6.0, links to collections and test plans from an RTC plan only resolve to the default configuration in the project they reside in.  In other words, you cannot link an RTC plan to a versioned requirements collection or test plan.  This limitation should be addressed in a future release by work item 355613.  The primary limitation that translates to is you are unable to auto generate workitems for requirements in a collection when working with projects that have configuration management enabled.

image

Missing that capability then the only work around is to manually create the workitems so that every requirement in the collection is linked to a corresponding work item.

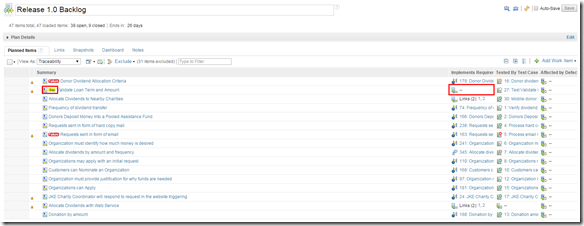
A traceability plan view in RTC that includes a color filter will help identify those plan items without requirements links.

image

Such a view will highlight cases where a work item may need to be removed as the scope has changed, e.g. the collection has had requirements removed.

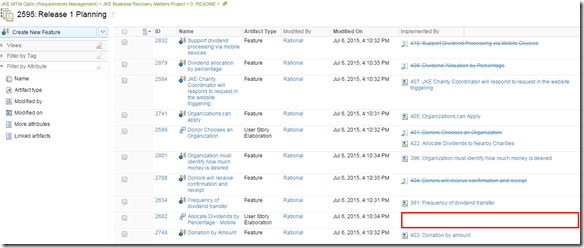
In DNG, view the collection with the Implemented By column included and scan for requirements with no corresponding work item.

image

If your requirements set is too large to view manually, export the collection view to a CSV file then open the exported file and filter or sort by the Implemented By column to more easily see those requirements without work items.

image

Conclusion

Of the limitations discussed, I find the first one, inability to filter by lifecycle status, will be more problematic for customers though I’ve found it’s usage to be mixed.  I’m also not particularly enamored with the workarounds described because they too are limited and involve some manual steps.  I would be interested in hearing how significant these limitations are in your environment or if you have additional ideas on workarounds for them.

Finding suspect links and requirements to reconcile in CLM 6.0 configuration management enabled projects

The newly released CLM 6.0 has some great configuration management across the lifecycle capabilities.  As described in Enabling configuration management in CLM 6.0 applications there are some considerations to be made before enabling configuration management.  One of these is

Do you rely on suspect links for requirements in RM or for requirement reconciliation in QM?

The reason being is that in this release, automatic detection of suspect links (artifacts that need to be evaluated and possibly modified because a linked artifact has changed) is not working in configuration management enabled DOORS Next Generation (DNG) projects. Further, the requirements reconciliation process in Rational Quality Manager (RQM) to find any changed/deleted requirements impacting associated test cases is also not supported in configuration management enabled RQM projects.  Note that a new mechanism for determining link suspicion is intended for a future release, in the interim though, teams must use a workaround.  I’ll explore some of those in this blog.

Suspect Links Workaround

To determine what requirements have changed and which impacted test cases may need updating, we’ll need to look at a test coverage view of requirements filtered by a some modified date.  It’s likely that you’ll want to know which requirements have changed since the last release baseline.

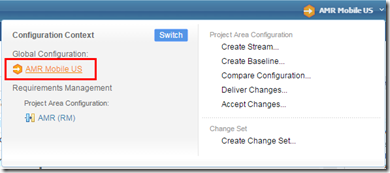
Let’s assume we are working in the AMR Mobile US global configuration in DNG.  Open the Configuration Context Banner Button (CCBB) and navigate to the global configuration.

image

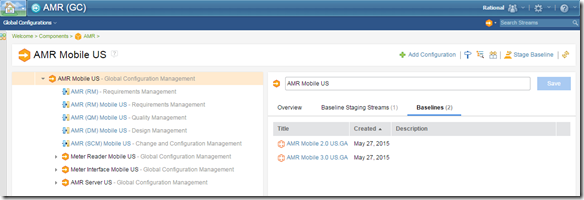
Show the baselines for this global configuration.

image

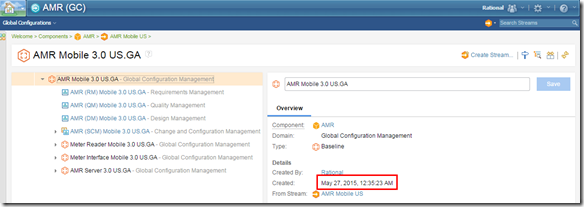
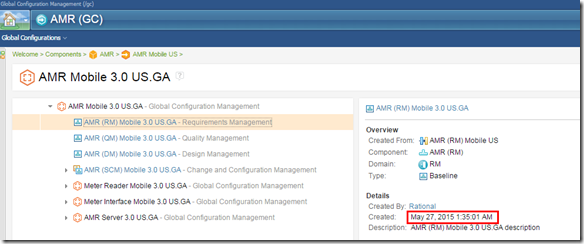
Observe the most recent baseline is AMR Mobile 3.0 US GA.  Drill down into it and see the baseline was created on May 27, 2015, 12:35:23 AM.

image

Note at this time, baselines for the each of the contributors to the global configuration must be created first before the baseline for the global configuration can be committed/finalized.  This means there likely be some time disparity between the global configuration baseline and the baselines for contributing local configurations (they could be earlier or later than the global configuration creation date).  For this reason, it’d be more accurate to use the local configuration baseline creation time for the filtering.  While looking at the global configuration baseline, select the row with the desired local configuration and observe its creation time on the right.

image

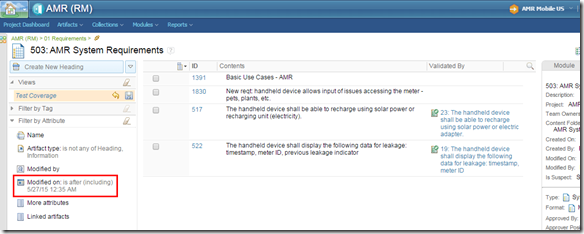
While viewing requirements of interest, likely on a per module by module basis, e.g. AMR System Requirements, open a Test Coverage view and add a Filter by Attribute for Modified on set to be after the baseline date.

image

Here we see there have been four requirements altered, two which have no linked test case, but may need one if they are new, and two that have linked test cases, but may need to be updated.

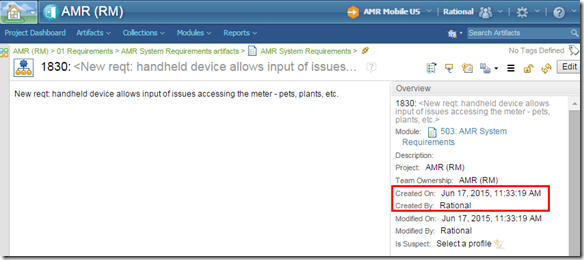
Now you could look at each individual requirement one by one to understand if they are new or modified.  In this example, opening requirement 1830 shows it has been created since the baseline date.

image

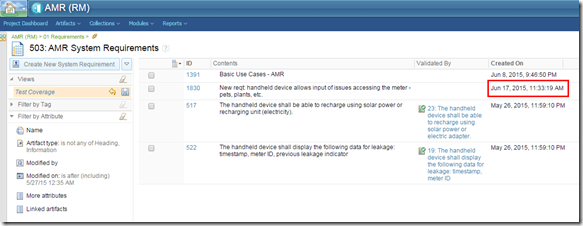
You could also add the Created On attribute to the view columns displayed.

image

This requirement doesn’t have a related test case so now you would evaluate whether one should be created.

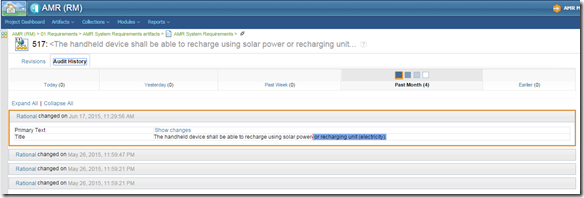
Looking at requirement 517, you observe that it was created before the baseline and modified since.  There is a related test case but you need to understand what the change was to better evaluate if it necessitates a change in the test case.

Open the requirement history and get a sense of the changes.

image

Should the changes be such that a reevaluation of the test case is warranted, follow the Validated By links to navigate to the test case(s) and check if they need updating.

To track the potential impact of those substantive requirement changes, you could tag the requirements and create a traceability view to look only at those.

image

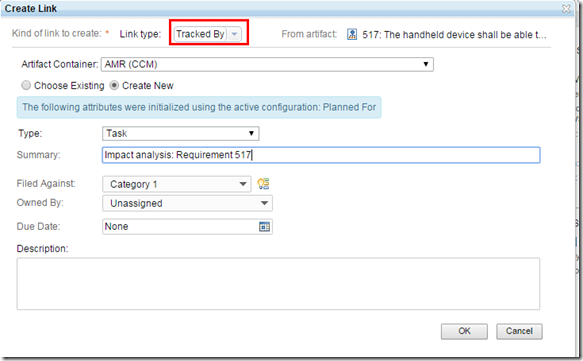
Alternatively, create a Tracked By link from the suspect requirement to a new RTC work item task that would be assigned to the test team to evaluate whether any linked test cases should be updated.

image

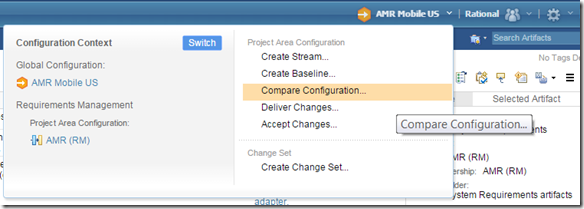
Now rather than going through each requirement individually, an alternative is to make use of the Compare Configuration capability to compare the current local DNG configuration/stream to the DNG baseline included in the AMR Mobile 3.0 US GA baseline.

image

image

image

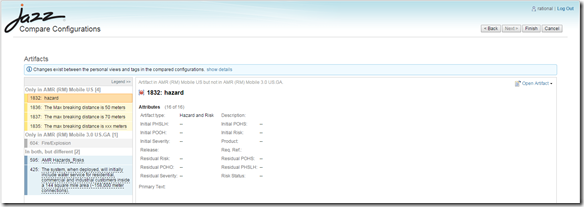
The compare results will show additions, changes and deletions to project properties, folders and artifacts.  With this information, the analyst can make a reasonable determination of how substantive each change was.  Armed with this information, they would need to return to the Test Coverage view(s) and tag the appropriate requirements as suspect and/or create RTC work items to analyze the linked test cases.  Note that previously we were looking at requirements changes on a per module basis (if modules were being used) but the Compare Configuration will look at all changes to all artifacts across the stream, that is, consolidating all change and not giving a module perspective.

Now if you were paying attention to my scenario,  you’ll notice that the last screen shot above, showing the results of the compare, doesn’t line up with the Test Coverage view shown earlier as the system requirements that were shown to have changed since the baseline are not shown in the compare results.  No, this isn’t a bug in the software.  I was using a shared internal sandbox whose configuration was changed in between the time when I started writing this blog and the time I tried to capture the compare results.  Rather than trying recreate the scenario, I left things as they were as I think I still get the concept across (though the anal side of me really has a problem with it all not lining up!).

Requirements Reconciliation Workaround

Requirements reconciliation is a capability in RQM that looks at the requirements linked to a test case or the requirement collection linked to a test plan and determine if there are new, updated or deleted requirements that necessitate changes in the test case(s).  In CLM 6.0, requirements reconciliation is not supported in projects that have configuration management enabled.

While you can query for test cases changed since a certain baseline date, this doesn’t really help determine if there are test cases to be updated due to requirements changes.  It’s not possible from RQM to query on test cases and filter based on attributes of the linked requirements.

Thus, the reconciliation process would need to be driven by DNG such that the tester would need to use the same technique used by the analyst for the suspect links workaround.  That is, the tester would look at a test coverage view of requirements in DNG, filtered to show requirements updates since the baseline date and evaluate if a test case addition, deletion or update was warranted.  This process would be further helped if the analysts used tagging as previously described so that that tester wouldn’t need to sift through all the requirements to find only those with substantive changes.  Use of impact analysis tasks in RTC would as well.

Use of these test coverage views would only identify requirements added or changed since the baseline.  It would not list requirements removed.  So for a comprehensive view of requirements changes that need to be reconciled with test cases, RM stream needs to be compared against the baseline to see any requirements that have been deleted.

Conclusion

While it is unfortunate that this initial release of the global configuration management capability doesn’t include support for suspect links and requirements reconciliation, there are some manual workarounds available, while not ideal, can help mitigate the gap until such time such time a replacement is available.  For some customers, such a manual process may be untenable due to the volume of changes between baselines.  Rather than performing the analysis after the fact, perhaps being more proactive about flagging potential impacts from the beginning of and throughout the release is more appropriate.  As requirements get changed, assess then whether there are test case updates needed by tagging the requirement and/or creating an impact analysis task in RTC.  These can be reviewed/refined at different milestones throughout the release.  Again not ideal but does distribute the analysis burden.