
One element of sizing the servers for the IBM Continuous Engineering (CE) solution is the current and projected data scale (along with data shape, user scale and workload). There are also recommended artifacts limits to keep an application performing well, such as 200K artifacts per DNG project area (as of v6.0.5 and noted here).
Whether you are trying to project future growth based on current sizing or ensure you are staying within recommended limits, it is useful to know how many artifacts currently exist in a repository (or other “container” such as a project area). Each application provides different means of getting this information.
DOORS Next Generation (DNG)
Vaughn Rokosz has written a very good article on the impact of data shape on DNG performance. He provides several SQL and SPARQL queries to monitor artifact counts. I won’t repeat them here but go to the link to minimally get the queries for total number of artifacts and versions in the repository and artifacts in the project areas.
Rational Team Concert (RTC), Rational Quality Manager (RQM) and Rational Model Manager (RMM)
Since these applications share a common storage service, they have similar means to get to the artifact counts. As a Jazz Admin you can run a repotools command or a web service.
Option 1: use repotools from command line
repotools-<context>.bat -listItemStats adminUserId=<jazz admin ID> adminPassword=<jazz admin password> repositoryURL=https://<server:port>/<context>logFile=<filename>
Option 2: use web service from browser
https://<server:port>/<context>/service/com.ibm.team.repository.migration.internal.stats.IDBTableSizeHttpService/
for <context>, use ccm, qm or am for Change Configuration Management, Quality Management or Architecture Management applications.
Note that both of these options can take some time to execute so be aware of possible load put on the server. I suggest running them during lighter load times. You can first run in a test environment with production like data to get a sense of timing and load.
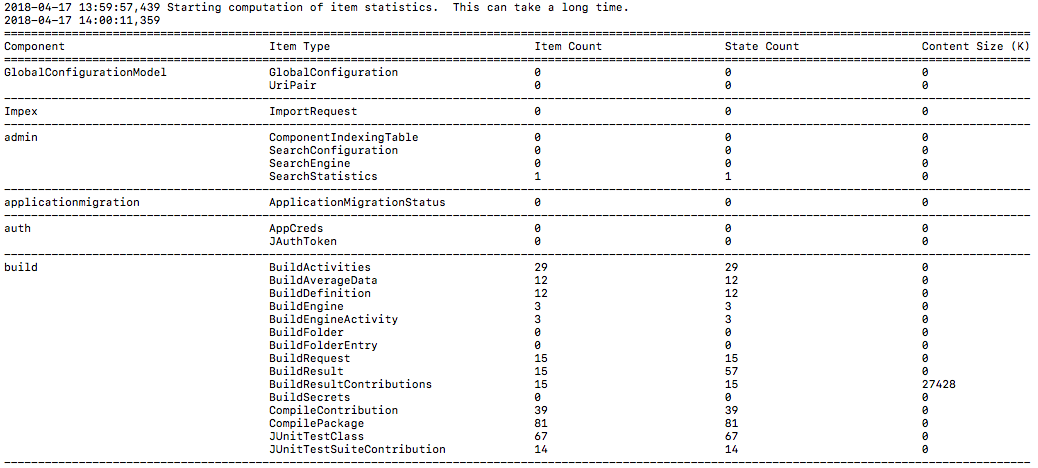
Sample CCM artifact counts output

Sample QM artifact counts output
Starting with v6.0.3, administrators can monitor Jazz application metrics through the use of JMX MBeans. One of the MBeans is Item Count Details which contains similar information as provided by the listItemStats repotools command and IDBTableSizeHttpService web service. The Item Count Details MBean, once enabled can be viewed from RepoDebug or an enterprise monitoring tool capable of receiving published JMX inputs. This is the preferred method as you can capture that data over time, see trends, set alerts and thresholds and correlate with other monitored data.
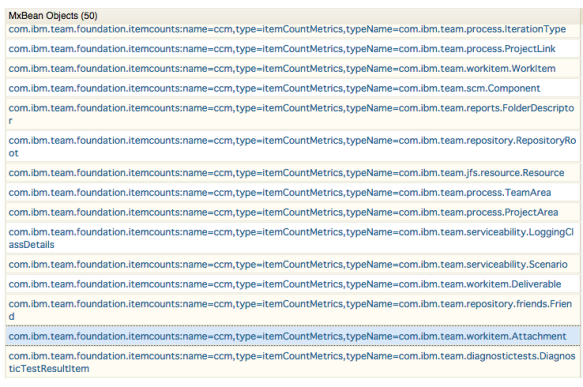
Item Count Details MBean Objects
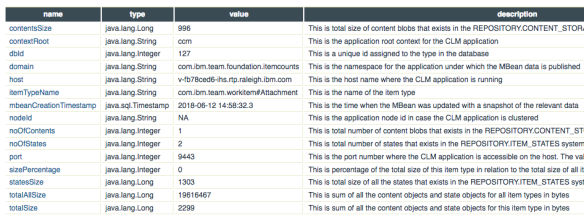
Attachment Item details
