
About a year ago, I was asked to begin considering what scenarios could drive load on a Collaborative Lifecycle Management (CLM) application server that could lead to outages or overall diminish the end user’s quality of service. These aren’t necessarily long running scenarios but those that are known to use large amounts of system resources (e.g. high CPU, memory, heap usage). As such, they have been known at times to degrade server performance and negatively impact user experience.
After reviewing a number of problem reports and escalations plus several discussions with Support, Services and Development resources, I identified scenarios for several of the applications. We coined the term ‘expensive scenarios’ though our User Assistance team recently indicated that it could be misconstrued and a more apt name would be ‘resource-intensive’.
The first set of scenarios were published in v6.0.3 and documented as Known Expensive Scenarios. The title will be changed in the next release to be Known Resource-intensive Scenarios.
For each of the identified scenarios, there is a description of what it is and under what conditions it could become resource-intensive. Further, if there are any known best practices to avoid or mitigate the scenario from becoming resource-intensive, these too are captured. These practices could include adjusting some application advanced properties that tunes the scenario behavior some or a change in work practices for when and how the scenario is invoked.
For example, importing a large number of requirements into DOORS Next Generation (DNG) can consume high resources as subsequent to the import, indexing of the newly imported artifacts occurs, which can block other user activity. When the volume of imported data is high and/or several occur at once, system performance could degrade. The wiki describes this scenario, identifies that there are some advanced properties that limit the number of concurrent ReqIF imports as well as the recommendation that these imports be kept under 10K requirements or be performed when the system is lightly loaded.
Knowing these scenarios help in a couple of ways. First, as your process and tools teams define usage models for one of these applications, knowing that a particular usage pattern can potentially drive load on the server leading to degraded performance allows that usage model to be adjusted to avoid or reduce the likelihood of that occurring. Second, in situations of poor performance or worse, knowing if these scenarios are occurring could help identify root cause.
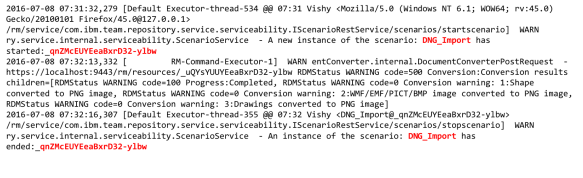
This latter case is helped by the logging of start and stop markers when a resource-intensive scenario occurs. Each marker includes the Scenario ID (from Table 1) and a unique instance ID.
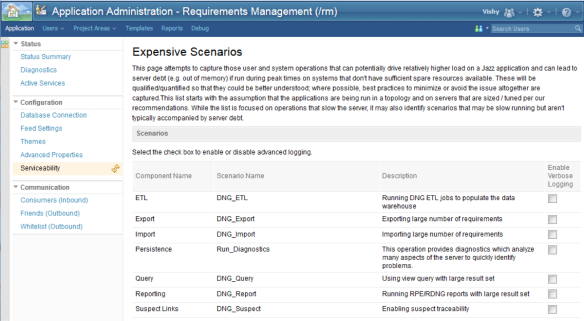
 To get additional details when the scenario occurs and to aid in understanding its characteristics, advanced (verbose) logging can be enabled. This can be done from the Serviceability page of an application’s admin UI. Note the enabling verbose logging does not require a server restart.
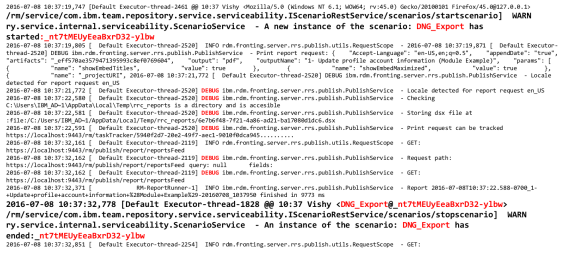
Now when a performance or system anomaly occurs and the application logs are reviewed, should it have occurred during a resource-intensive scenario, you may have a clue as to cause. The additional logging should at a minimum include the data specified in Table 2.
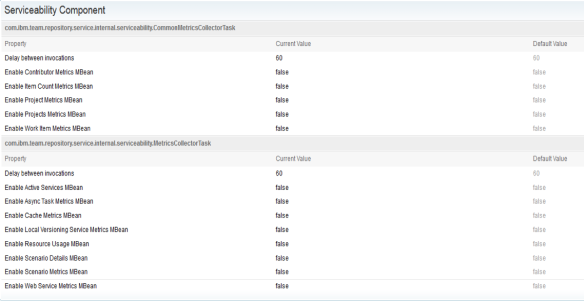
As part of our serviceability improvements in v6.0.3, the CLM applications publish various JMX MBeans that may be collected and trended by enterprise monitoring tools such as IBM Monitoring, Splunk, LogicMonitor and others. MBeans exist for several application metrics including counts/occurrences of resource-intensive scenarios.
Each MBean to be published must first be enabled from an application’s admin UI advanced properties page.
After doing so, the monitoring application can be configured to capture that data and displayed on a dashboard.
Having a comprehensive enterprise monitoring strategy is essential for a well-managed CLM environment. Tracking occurrences of these scenarios and correlating them against other environment measurements give administrators (and IBM Support) insight when troubleshooting anomalies or proactively evaluating environment performance. In a subsequent post, I will talk further about what to monitor.
