Visualizing available Lifecycle Query Engine MBeans

In 6.0.3, the Engineering Lifecycle Management (ELM) solution began publishing Java Management Extensions (JMX) MBeans for managing and monitoring ELM applications. In 6.0.5, the Lifecycle Query Engine (LQE) application began publishing its own MBeans. The recommended mechanism for collecting and viewing any of these MBeans is through an enterprise monitoring solution. However, often while getting familiar with MBean content while building your monitoring dashboards, you just want to browse the MBeans from a running system without having to first ingest it into a monitoring tool.

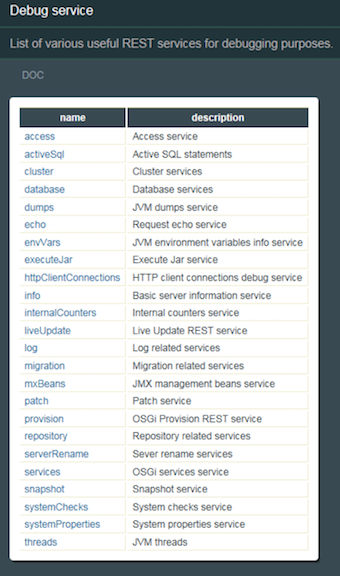
The typical method for doing so is via repodebug. This is described in the Troubleshooting section at the bottom of CLM Monitoring.

RepoDebug Main Screen

For the LQE application, repodebug can be used to view its MBeans if there are other MBean providers running on the same server. This is not typically the case as we recommend LQE be run on its own server. Fortunately, other options exist such as Jconsole and VisualVM. This post will describe how I used Jconsole to view the LQE MBeans from ELM 7.0 running on Windows and with Websphere Liberty as the application server. The instructions may differ slightly when used with traditional Websphere or another supported operating system.

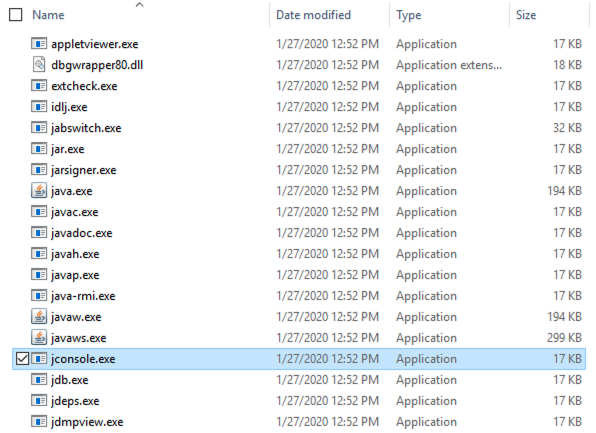
The base ELM install does not include Jconsole. It is generally part of any Java SDK install. I downloaded an IBM Java SDK to the LQE server. After expanding the zip file, navigate to the bin directory and run the jconsole.exe.

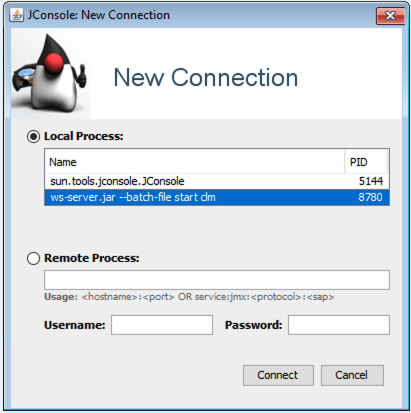
When the connection dialog appears, select Local Process and the ws-server.jar process then click Connect. I have not tried running this remotely using the Remote Process selection.

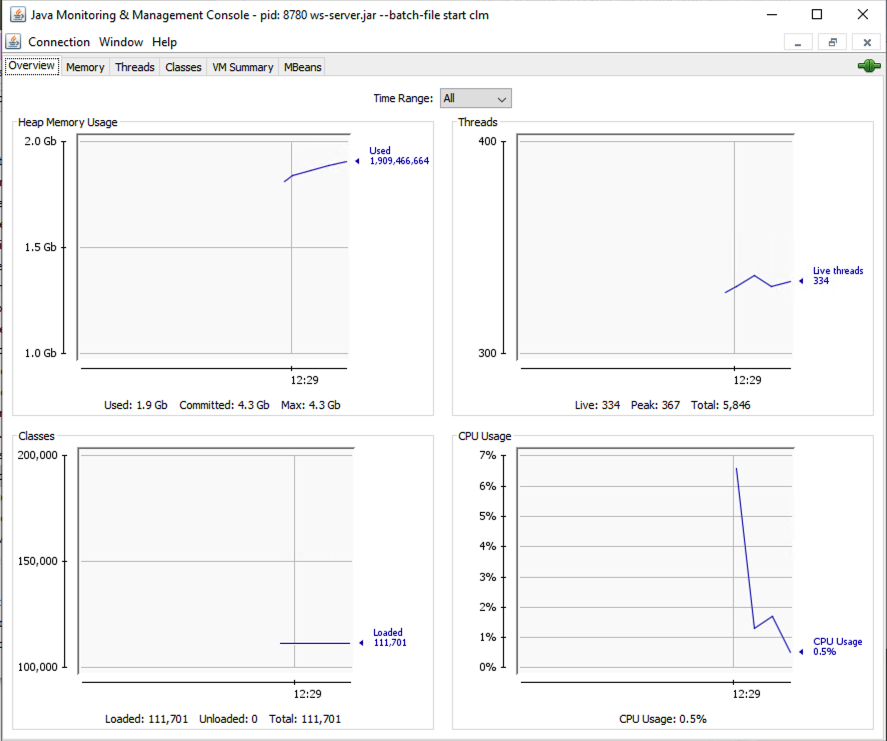
The main console window appears.

Select the MBeans tab.

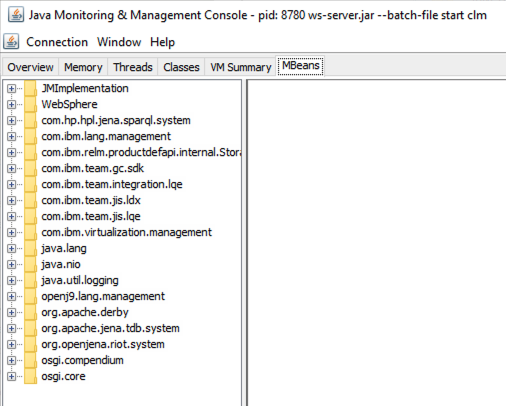
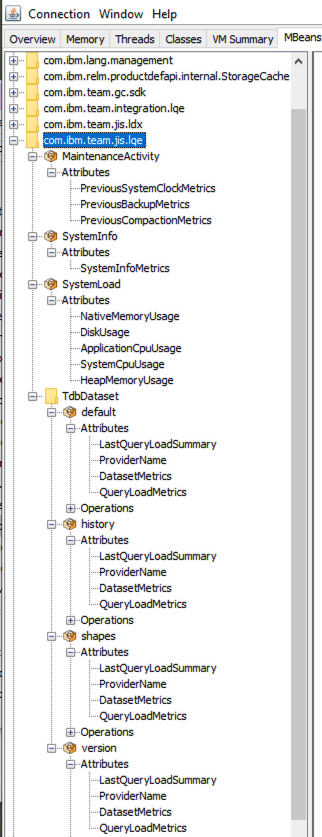
Here you see several domains of MBeans, only a two of which apply to LQE: com.ibm.team.integration.lqe and com.ibm.team.jis.lqe. You’ll see there are also domains related to GC and LDX as I am running this on a server with multiple applications (despite my earlier comments regarding running LQE on its own server, but this is a test system). Note unlike many of our application MBeans, which need enabling to have them published, the LQE MBeans are collected and published automatically.

As described in Monitoring the performance of Lifecycle Query Engine using MBeans, there are MBeans that provide performance and activity metrics for the processing of the Tracked Resource Set (TRS) feeds. You can view these by navigating to com.ibm.team.integration.lqe > IndexingAgentMetrics then expanding one of the TRS feeds down to Attributes as shown below.

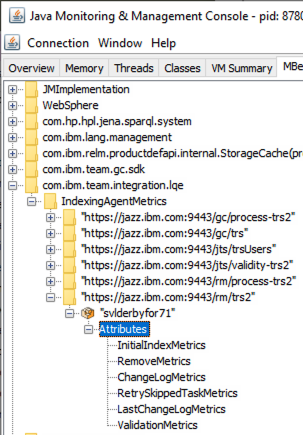
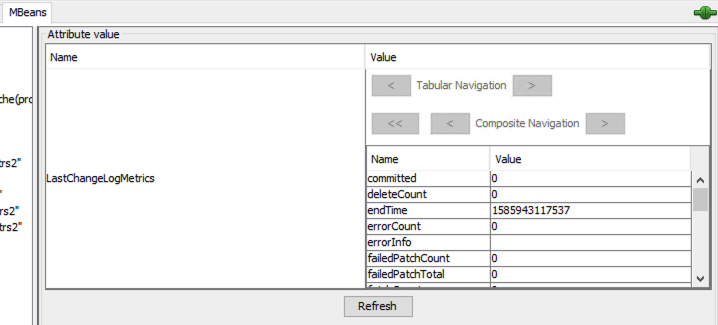
Select LastChangeLogMetrics in the Attributes list then double click javax.management.openbean.CompositDataSupport on the right panel under Value.

Now you can view and scroll through all the attributes for the LastChangeLogMetrics MBean

Similarly, you can navigate through the list of MBeans in the com.ibm.team.jis.lqe domain.

Viewing the MBeans this way only gives you the current snapshot of what has been published. You’ll get more value using an enterprise monitoring tool where the MBean data can be collected over time in a data warehouse from which dashboards showing trends and correlated with other MBean data can be created.

How to register your custom utilities as a resource-intensive scenario

In Resource-intensive scenarios that can degrade CLM application performance I describe how certain IBM Collaborative Lifecycle Management (CLM) application scenarios can be resource-intensive and known to degrade system performance at times. As I’ve intereracted with customers on their deployments and performance concerns, it is apparent that they are getting more and more creative in building custom automation scripts/utilities using our APIs. At times, these custom utilities have generated significant load on the system.

As a best practice, we now recommend that customers evaluate their custom utilities and determine if any are candidates to be resource-intensive. For those that are, they should be modified and registered as resource-intensive with appropriate start and stop scenario markers included in the code. Until recently, all we could provide to help do this was some code snippets.

Thanks to my colleagues Ralph Schoon, Dinesh Kumar and Shubjit Naik, we now have documented guidance and sample code to help you do this. Have a look at Register Custom Scripts As a Resource Intensive Scenario. Ralph also gives some additional detail behind the motivation for the custom scenario registration in his blog post.

Once registered, you will now be able to track their occurrence in the appropriate application log. If you’ve implemented enterprise application monitoring, you can track for available JMX MBeans as described in CLM Monitoring.

Detecting RTC SCM access not using Content Caching Proxy

One of our best practices for improved Rational Team Concert (RTC) Software Configuration Management (SCM) response times and reduced load on the RTC server is to use a content caching proxy server. These are located near users at servers in remote locations where the WAN performance is poor (high latency to RTC server). What is often missed, is that we also recommend they be placed near build servers, especially with significant continuous integration volume, to improve the repeated loading of source content for building.

This practice is not enforceable. That is, SCM and build client configurations must be manually setup to use the caching proxy. This is particularly troublesome for large remote user populations or where large numbers of build servers exist, especially when not centrally managed.

The question that naturally comes is how can one detect that a caching proxy is not being used when it should? One way is to look at active services and find service calls beginning with com.ibm.team.scm and com.ibm.team.filesystem for RTC SCM operations or com.ibm.team.build and com.ibm.rational.hudson for RTC build operations.

Since the IP address of the available caching proxies are static and known, you can find any entries on the Active Services page with a Service Name of any SCM or build related service calls that are not coming from an IP address (Scenario Id) belonging to a caching proxy. Since the active services entry captures the requesting user ID (Requested By), you can then check with the offending user to understand why the proxy wasn’t used and encourage them to correct their usage.

Active services detail is also available via the Active Services JMX MBean. If an an enterprise monitoring application is being used and integrated with our JMX MBeans, then it can be configured to capture this detail, parse it and generate appropriate alerts or lists to identify when a proxy is not being used.

One other option is to parse the access log for your reverse proxy.  Shown below is sample output from an IBM HTTP Server (IHS) access log.

The access log does not have user ID information but it does have the service calls and the IP address they are coming from.  You would need to have a way to determine associate an IP address with a user machine (for those entries not coming from a caching proxy).  Note that if a load balancer is used, the IP address recorded in the access log may not be the true IP address that originated the request.  For this reason and since the user ID information is not directly available, the Active Services method may be better.

Tips for improved monitoring of your DNG environment

Let’s assume that you are convinced that application monitoring of your IBM CE/CLM environment is a good best practice. There are many JMX MBeans defined in the MBeans Reference List that your enterprise monitoring application can collect and manage. If just getting started, focus on the set of MBeans described in CLM Monitoring Primer. Once you’ve implemented the base set, you can expand from there.

Proactively monitor those MBeans by setting recommended thresholds with corresponding alert notifications to prompt further investigation. Thresholds may need to be adjusted over time based on experience. Monitor normal operations to establish appropriate baselines and adjust thresholds accordingly to reduce false negative alerts. Note that some monitoring tools have the ability to use machine learning and statistical analysis to adapt thresholds.

Based on some of my recent customer experiences, for DNG in particular, there are two key items I recommend you monitor beyond what’s called out in the primer or even currently available via an MBean. These will help you optimize the performance of your deployment.

JFS indexBacklog
Jena index updates occur when a write is being processed by DNG. The status of the index can be monitored through an indexing page (https://<server:port>/rm/indexing). A backlog indicates there are updates yet to be passed on to the Jena indexer for processing (e.g. after a large import). Ideally the backlog of the indexer should be low on a well performing system. When high, system performance may suffer temporarily until the indexer catches up. Symptoms of heavy indexing can be slow performance, or users not seeing data immediately after creation. See technote 1662167.

Even better, for those clients using an enterprise application monitoring tool and gathering our pubished MBeans, there is one that tracks the index backlog. The JFS Index Information MBean is available as of 6.0.5 and collected by the IndexDataCollectorTask. It can be used to gather not only the size of the index but the backlog of items waiting to be indexed. By default, data is collected every 60 mins. Alerts can be set so that if the backlog gets high, e.g. over 1000, admins may choose to warn users and slow down system activity so the indexer can catch up.

DNG write journal file
Once the DNG indexer completes indexing of changes to artifacts, if there are no read operations in progress, the update is committed to the main index, otherwise, it is written to a journal file. Once the last active read operation completes, changes in the journal file are written to the main index. This approach allows in-progress read queries to maintain a consistent view of the index, while allowing new read queries to see the latest data.

The DNG write journal file (journal.jrnl) is located in server/conf/rm/indices/<id>/jfs-rdfindex. The size of the journal file can be monitored through standard OS commands and scripts or through OS integrations typically available with enterprise monitoring applications. This file will grow over time but should regularly go back to zero. In the unlikely event that it does not, it’s a sign of a bottleneck where read activity is blocking write activity. System performance may be impacted at this point. When this happens, it’s best for DNG users to pause their DNG activity while the system catches up. One customer does this by notifying their users, removing DNG from the Reverse Proxy configuration (commenting out its entry), monitoring the journal file size until it returns to zero, then adding DNG back into the proxy configuration and informing the users.

As a teaser to future content, check out 124663: As an administrator, I should be able to monitor my server using MBeans, which will provide new DNG application MBeans to further aid administrators in proactively monitoring and managing a DNG system.

Monitoring Jazz Applications using JMX MBeans

I recently published a blog post on jazz.net regarding our serviceability strategy and use of JMX MBeans to monitor Jazz Applications. If you’ve heard me speak on this topic, you know that I believe that having an monitoring strategy is a best practice and essentially imperative for any deployment involving our global configuration management capability. I would even extend that to deployment of RTC clustering as well.

Have a look at the blog post here:
Monitoring Jazz Applications using JMX MBeans

Resource-intensive scenarios that can degrade CLM application performance

About a year ago, I was asked to begin considering what scenarios could drive load on a Collaborative Lifecycle Management (CLM) application server that could lead to outages or overall diminish the end user’s quality of service.  These aren’t necessarily long running scenarios but those that are known to use large amounts of system resources (e.g. high CPU, memory, heap usage).  As such, they have been known at times to degrade server performance and negatively impact user experience.

After reviewing a number of problem reports and escalations plus several discussions with Support, Services and Development resources, I identified scenarios for several of the applications.  We coined the term ‘expensive scenarios’ though our User Assistance team recently indicated that it could be misconstrued and a more apt name would be ‘resource-intensive’.

The first set of scenarios were published in v6.0.3 and documented as Known Expensive Scenarios.  The title will be changed in the next release to be Known Resource-intensive Scenarios.

For each of the identified scenarios, there is a description of what it is and under what conditions it could become resource-intensive.  Further, if there are any known best practices to avoid or mitigate the scenario from becoming resource-intensive, these too are captured.  These practices could include adjusting some application advanced properties that tunes the scenario behavior some or a change in work practices for when and how the scenario is invoked.

For example, importing a large number of requirements into DOORS Next Generation (DNG) can consume high resources as subsequent to the import, indexing of the newly imported artifacts occurs, which can block other user activity.  When the volume of imported data is high and/or several occur at once, system performance could degrade.  The wiki describes this scenario, identifies that there are some advanced properties that limit the number of concurrent ReqIF imports as well as the recommendation that these imports be kept under 10K requirements or be performed when the system is lightly loaded.

Knowing these scenarios help in a couple of ways.  First, as your process and tools teams define usage models for one of these applications, knowing that a particular usage pattern can potentially drive load on the server leading to degraded performance allows that usage model to be adjusted to avoid or reduce the likelihood of that occurring. Second, in situations of poor performance or worse, knowing if these scenarios are occurring could help identify root cause.

This latter case is helped by the logging of start and stop markers when a resource-intensive scenario occurs.  Each marker includes the Scenario ID (from Table 1) and a unique instance ID.

ScenarioStartStop
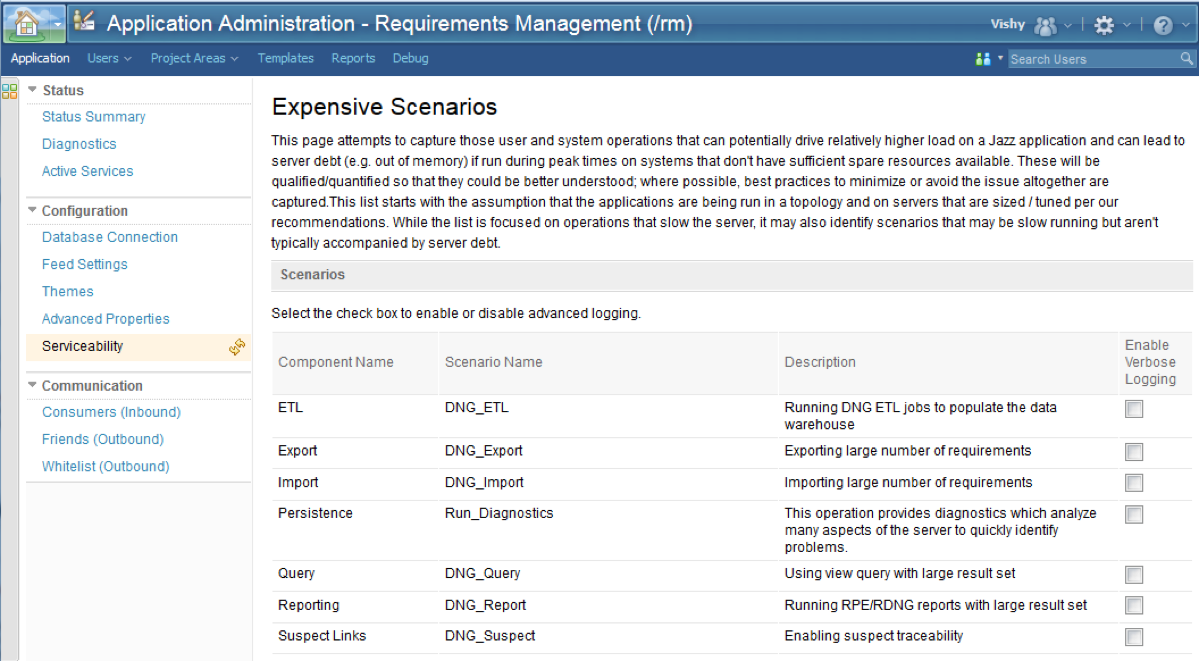
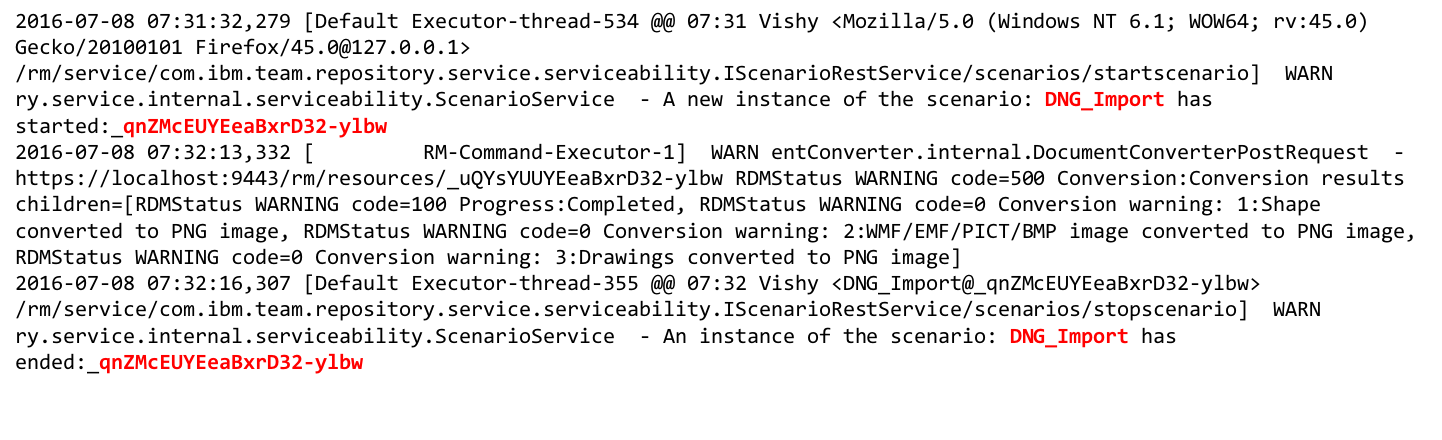
To get additional details when the scenario occurs and to aid in understanding its characteristics, advanced (verbose) logging can be enabled.  This can be done from the Serviceability page of an application’s admin UI.  Note the enabling verbose logging does not require a server restart.

ScenarioEnableAdvLogging

Now when a performance or system anomaly occurs and the application logs are reviewed, should it have occurred during a resource-intensive scenario, you may have a clue as to cause.  The additional logging should at a minimum include the data specified in Table 2.

ScenarioAdvLogging

As part of our serviceability improvements in v6.0.3, the CLM applications publish various JMX MBeans that may be collected and trended by enterprise monitoring tools such as IBM Monitoring, Splunk, LogicMonitor and others.  MBeans exist for several application metrics including counts/occurrences of resource-intensive scenarios.

Each MBean to be published must first be enabled from an application’s admin UI advanced properties page.

MBeansEnable

After doing so, the monitoring application can be configured to capture that data and displayed on a dashboard.

MBeansStats

Having a comprehensive enterprise monitoring strategy is essential for a well-managed CLM environment.  Tracking occurrences of these scenarios and correlating them against other environment measurements give administrators (and IBM Support) insight when troubleshooting anomalies or proactively evaluating environment performance.  In a subsequent post, I will talk further about what to monitor.